The inflation rate is the “average” rate of increase of prices over time. Typically, the Federal Reserve targets an annual rate of core inflation of around 2%. This does not mean that all prices increase by 2%. Some go up, some go down, and some stay the same. Core inflation excludes the prices of food and energy, because they tend to be volatile over short periods of time. If increases in the prices of food or energy are driving inflation, then that will cause the prices of other products to increase, which will be captured in the core inflation rate.
Figure 1 shows that core inflation rates have been elevated above the 2% target since early 2021 as the economy began to recover from the COVID-19 pandemic.
This has made inflation a key topic of discussion in the news and from politicians. Conversations regarding inflation usually revolve around the cause and who is to blame.
There are two ways in which a country can experience inflation:
Demand-Pull Inflation is when people want to buy more of a product than companies can produce, thus driving up prices
Cost-Push Inflation is when the costs of production (e.g., raw materials and wages) increases and drives up prices
In the past, when the United States has seen an elevated inflation rate, it is typically due to demand-pull inflation because the economy is strong and people want to buy more than companies can produce. The increase in demand for products drives up prices. In the 1970s, the United States experienced Cost-Push inflation due to the OPEC oil embargo, which increased the price of transportation and raw materials.
The current elevated inflation rate is unique, because the United States is experiencing both Demand-Pull and Cost-Push inflation. In this article, I will talk about both types of inflation as well as elevated gasoline prices.
The Economy is Strong
While the inflation rate tends to dominate news headlines, in general, the United States economy is strong. Figure 2 shows that the labor force has been steadily growing for nearly two years, at a similar rate to before the pandemic and has essentially returned to the pre-pandemic level (in a previous post, I explored why the labor force did not return to the pre-pandemic trend and why there appears to be a shortage of workers).
There is always a persistent level of unemployment in the economy as people transition between jobs (either voluntarily or involuntarily) or transition between retirement and seeking work. Therefore, the unemployment rate will never fall to zero. However, Figure 3 shows that the unemployment rate is very low and currently lower than the pre-pandemic average from 2018-2019. With the unemployment rate this low, most people who are seeking a job are able to find one.
Because of the low unemployment rate, companies need to compete with each other for workers, which has caused the average hourly wage rate to increase at a faster rate than before the pandemic, which can be seen in Figure 4. In May 2022, the average hourly wage rate is $31.95. This is around 4% higher than the hourly wage rate would have been had wages continued to grow at the pre-pandemic trend.
Because of the low unemployment rate and increase in wages, combined with the stimulus payments from 2020 and early 2021, consumer spending, when adjusted for inflation, has largely returned to the pre-pandemic trend, as seen in Figure 5.
Figure 6 shows that spending on non-durable goods excluding food and energy (i.e., clothing, shoes, paper towels, soap, etc.) was slightly elevated during 2020 and 2021 relative to the pre-pandemic trend and has fallen below the pre-pandemic trend in 2022.
Figure 7 shows that there has been a large increase in spending on durable goods (i.e., cars, trucks, appliances, electronics, furniture, etc.) relative to the pre-pandemic trend.
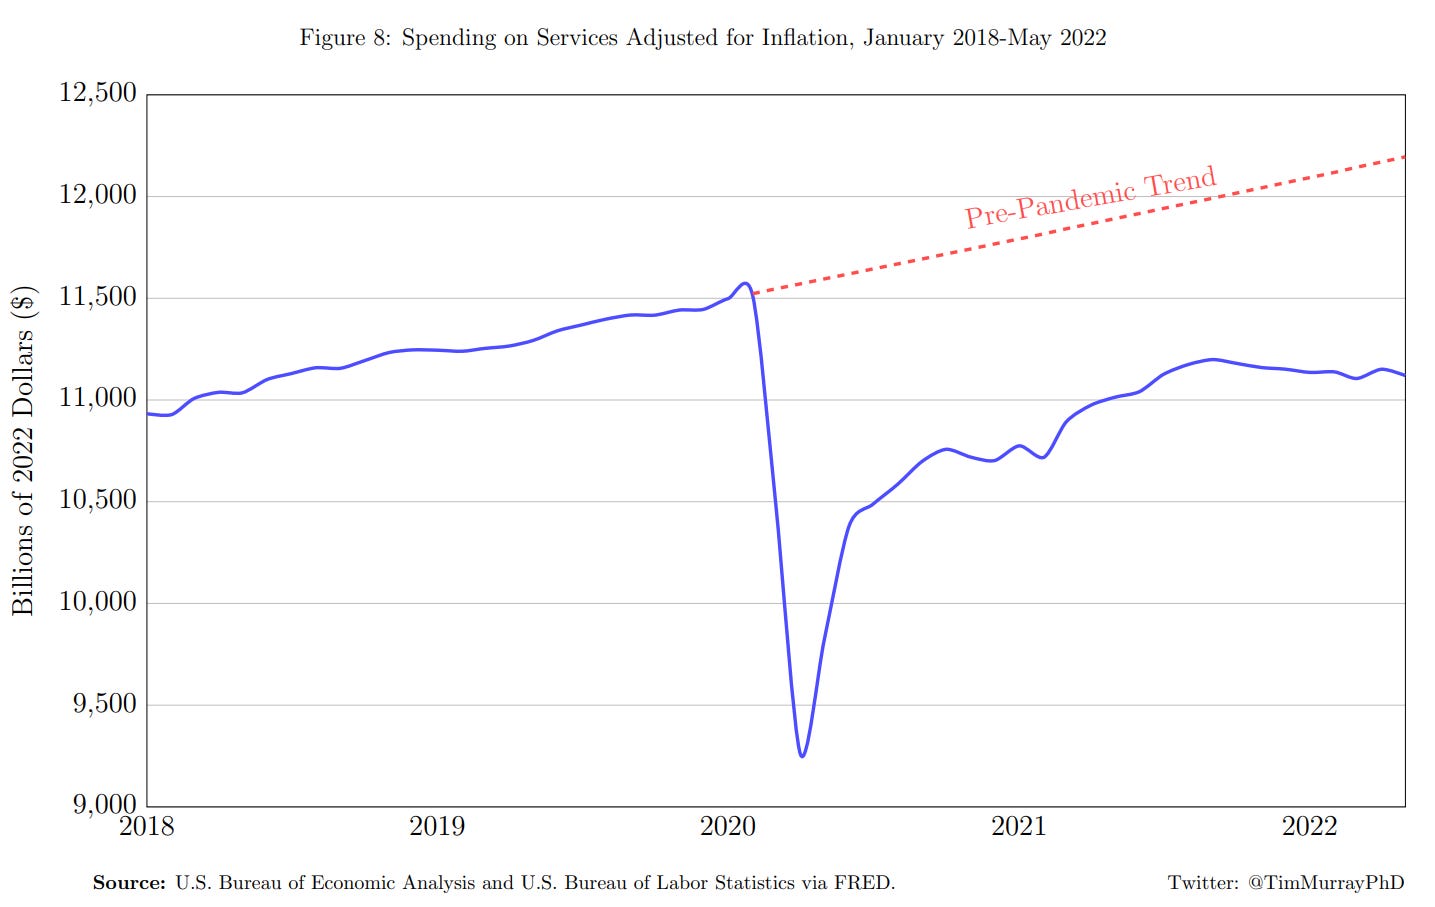
Figure 8 shows that spending on services (i.e., house cleaning, legal advice, auto repair, haircuts, doctors, airplane flights, babysitting, etc.) fell during the pandemic, and has not returned to the pre-pandemic trend.
The increase in spending on durable goods has offset the decline in spending on services so that spending in general has essentially returned to pre-pandemic levels, even when adjusting for inflation. As a result, Figure 9 shows that the growth rate in Gross Domestic Product (GDP) has been elevated above the pre-pandemic average, even when adjusted for inflation. These are all signs of a strong economy, which is causing demand-pull inflation. The Federal Reserve estimates that demand driven inflation is responsible for 29% of the current inflation above the pre-pandemic average.
Supply Chain Issues Persist
A “supply chain” represents the process of transforming raw materials into ready to sell products. The supply chain is a complex web that involves products being shipped from one country to another and being refined and processed. If any factories or ports are shut down or operating at a limited capacity along the supply chain, there is a downstream effect at other points in the supply chain reducing the overall supply of products, which ends with higher prices at retail outlets.
During the COVID-19 pandemic, factories around the world shut down or operated at partial capacity. Currently, China still continues a zero-COVID policy and continues to lockdown cities as their vaccination rate, particularly among the elderly, is low. China accounts for almost 29% of global manufacturing, so their zero-COVID policy disrupts factories, which reduces that volume of manufacturing around the world and decreases the speed at which raw materials and finished products leave Chinese ports to be dispersed to the rest of the world.
The supply chain has been further disrupted due to Russia’s invasion of Ukraine as those countries combined produce 25% of the world’s wheat, 60% of sunflower oil, and 30% of barley. Russia is also a major producer of world’s supply of fertilizer and critical minerals used for the production of computer chips.
The disruptions in China, Ukraine, and Russia are large. This has led to a 53% decline in global shipping schedule reliability relative to the pre-pandemic average, which can be seen in Figure 10. It has also led to an increase in the average delay in global shipping from 4 days before pandemic to between 6 and 8 days, which can be seen in Figure 11.
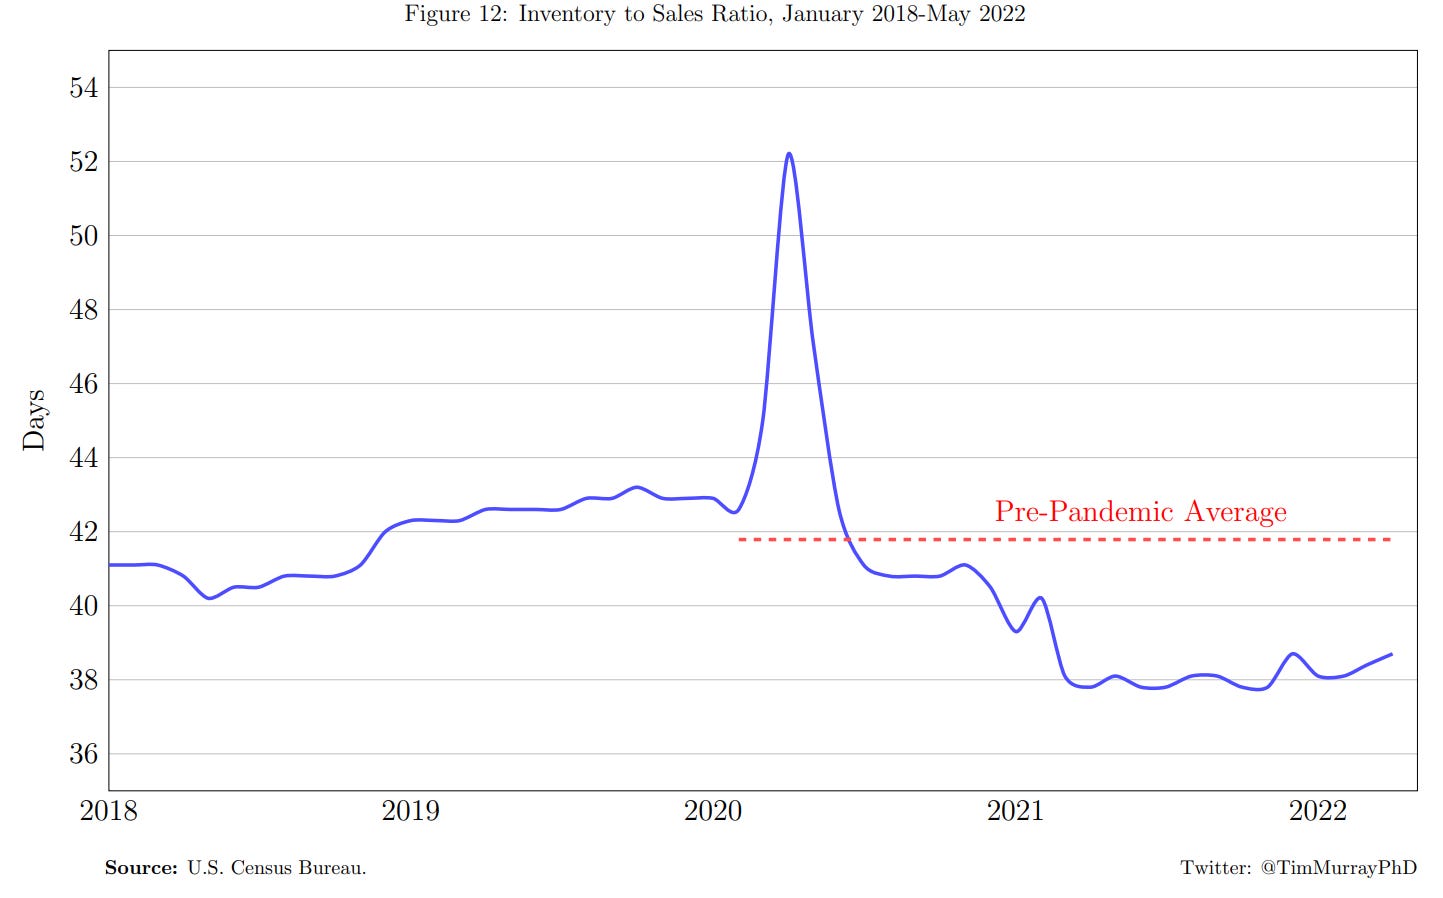
This means that raw materials and finished products are taking longer to move from country to country. Figure 12 shows the Inventory to Sales Ratio for the United States. This ratio shows how many days of inventory the average company has on hand. As a result of these global supply chain challenges, businesses in the United States have a lower amount inventory on hand than they did before the pandemic. Lower inventory levels mean there is a reduction in the supply of products and services, which leads to an increase in prices.
The supply chain issues are causing cost-push inflation. The Federal Reserve estimates that 52% of the current elevated inflation is due to issues with the supply of goods and services.
Price of Gasoline
The markets for oil and gasoline are not exclusive to individual countries. Oil is produced in individual countries and then sold on the worldwide market. This means that oil that is extracted in the United States does not stay in the United States, it is goes into the international market for oil. Oil is then purchased and refined into gasoline, which also operates on an international market. The price of gasoline is heavily tied to the price of oil.
The United States is the largest oil producer in the world, and produces 14.5% of the world’s oil. Figure 13 shows oil and gas extraction in the United States has not recovered from the decline that occurred during the pandemic. This is a trend that is true among most of the world’s oil producers, meaning there is a decline in the worldwide supply of oil.
The second largest producer of oil is Russia, accounting for 13.1% of the world’s oil. The embargo on Russian oil due to their invasion of Ukraine, has further decreased the supply of oil worldwide. Meanwhile, the demand for oil has been increasing as the world recovers from the COVID-19 pandemic and worldwide economic activity increases. These two factors have caused an increase in the price of oil, which in turn has caused an increase in the price of gasoline, as seen in Figures 14 and 15.
Final Thoughts
The worldwide economy is facing new challenges as countries recover from the COVID-19 pandemic. It is easy to look at what is going on in the United States as isolated, and place blame on specific people or political parties. However, there is no one person or political party to blame. High inflation is not a problem that is unique to the United States. Figure 16 shows that all major countries are experiencing higher than normal cost-pull inflation because of the supply chain issues.
The United States is slightly higher because we are experiencing more demand-pull inflation due to a strong economy. The United States has had a robust recovery from the pandemic because of the economic stimulus that was provided. It is possible that too much stimulus was provided, which is causing the economy to overheat, that is something we will not know until more time has passed and data become available. I do think it was better to err on the side of caution and that too much stimulus was better than too little. The effects of financial ruin that could have happened to many families during the pandemic would have had a much greater long-term negative impact on the economy than a period of higher inflation, which can be driven down by the Federal Reserve.
The Federal Reserve will continue to increase interest rates in an effort to slow the economy and curb demand-pull inflation. However, inflation will remain elevated until supply chain issues are fixed, as more than half of current elevated inflation is being driven by supply issues.


Thank you for this. I have referenced it in my own Substack newsletter, and I think my (small number of) readers will enjoy it.
Would argue that looking at M&A markets would tell a different story and signals that we have hit the top and are on the way to the bottom