


Is the United States in a Recession?
Data suggests the answer to this question is complicated and not definitive

Gross Domestic Product (GDP) is the total market value of all finished goods and services that are produced over a specific time period. GDP is typically measured both annually and quarterly. GDP is a measure of how “healthy” the economy is.
There are four components that make up GDP:
Consumer spending accounts for nearly 70% of GDP in the United States. Consumer spending can be split into two categories. Goods are tangible products, such as furniture, cars, gasoline, food, and clothing. Services are non-tangible products, such as haircuts, car repair, home repair, landscaping, healthcare, and banking.
Government spending on goods and services accounts for around 17% of GDP. Federal, state, and local governments spend money on goods and services, just like people do. They spend money on office supplies, cars, clothing, tanks, airplanes, fuel, etc. They also spend money to invest in infrastructure such as roads, bridges, and sidewalks. This category does not include transfer payments (e.g., social security, food stamps, tax credits) or interest payments on government debt.
Investment accounts for around 18% of GDP. Investment refers to private domestic investment, or capital expenditure by companies to expand business activities (e.g., buy machinery or build a new facility). Investment also includes inventory holdings by companies and the construction of new residential housing.
Goods and services that are produced in the United States and are exported to another country add to GDP. Goods and services that are produced in another country and imported in to the United States are subtracted from GDP. Net exports are defined as exports minus imports. Because the United States imports more than it exports, net exports subtract about 5% from GDP.
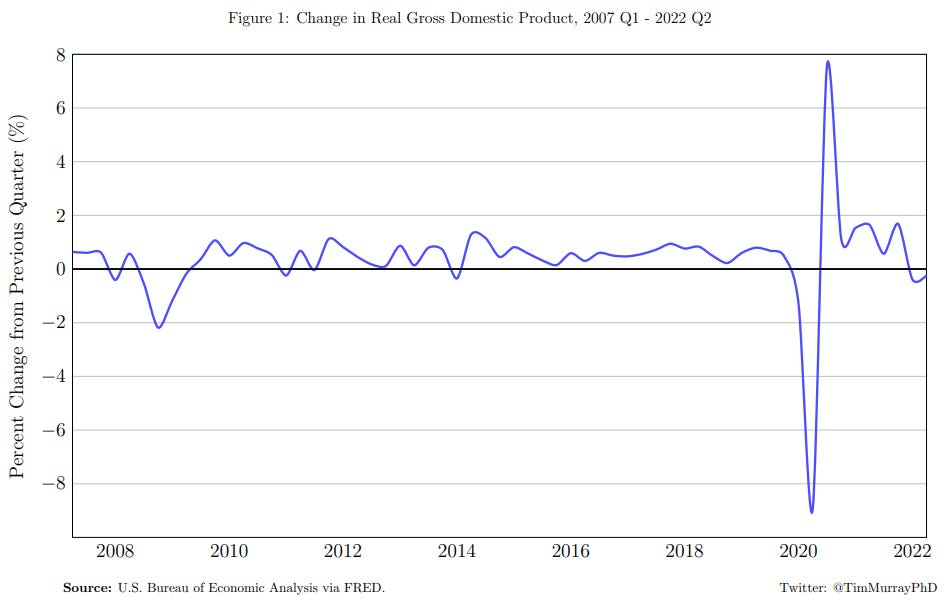
The Bureau of Economic Analysis (BEA) just released the advanced estimate for real GDP (real means that historical dollar values have been adjusted to account for inflation). The estimate shows that for the second quarter in 2022, real GDP was 0.23% lower than it was in the first quarter (this is a 0.9% decrease at an annualized rate, which is the number commonly seen in the news). The first quarter GDP in 2022 was 0.40% lower than the fourth quarter of 2021. Historical real GDP data can be seen in Figure 1.
Having two consecutive quarters of negative real GDP growth has prompted concerns that the United States economy is in a recession. The National Bureau of Economic Research (NBER) defines a recession as:
“a significant decline in economic activity that is spread across the economy and that lasts more than a few months. The committee's view is that while each of the three criteria—depth, diffusion, and duration—needs to be met individually to some degree, extreme conditions revealed by one criterion may partially offset weaker indications from another.”
A common “rule of thumb” is that there is a recession if there are two consecutive quarters of negative GDP growth, which the United States has had. This has prompted politicians and news outlets to make claims of a recession.
However, the NBER, which is officially responsible for determining the start and end dates of a recession, does not use GDP as metric to determine a recession. The NBER uses the following metrics:
Real personal income less transfers
Nonfarm payroll employment
Real personal consumption expenditures
Wholesale-retail sales adjusted for price changes
Employment as measured by the household survey
Industrial production
The NBER does not have a fixed rule as to what classifies a recession and what does not. Figure 1 shows that there have been quarters of negative GDP growth between the Great Recession and the COVID-19 pandemic, but these were not classified as a recession. So, is the United States in a recession? Let’s talk about it in more nuanced detail.
The Quarter 2 GDP report is an “Advanced Estimate”
In practice, it is impossible to know the “exact” value of GDP; there are too many goods and services that are produced to physically count them all. The quarterly releases of GDP estimates provide a “first look” of economic activity and are called an “advanced estimate.” This estimate is made using a variety of data, including survey results, tax data, and trade data. GDP figures are then revised 30 days after the initial release, and then again after 60 days. These revisions incorporate data from the Bureau of Labor Statistics (BLS) or from the Census Bureau that may not have been available when the “advanced estimate” was reported. Additionally, the BEA updated GDP estimates annually for the previous three years as new data or more advanced statistical methodology becomes available.
The revision process is often confusing, and some even think that the revisions are a conspiracy by the government to help incumbent politicians. The reality is, data is difficult and time consuming to collect and analyze. Different surveys are administered at different times and data are reported at different frequencies by different agencies. Therefore, the further we get from the initial estimate, the more data that will be available to revise these estimates (more detailed information on the statistical methodology and data sources the BEA uses to estimate and revise GDP are available here and here).
The first revisions to the “advanced estimate” have an average deviation of 0.50 percentage points. By the time GDP estimates undergo their third annual revision, the average deviation is 1.23 percentage points from the initially reported “advanced estimate.”
Based on the magnitude of these revisions, the annualized change in GDP growth for the second quarter of 2022 could be as high as 0.33% or as low as -1.23%, compared to the -0.9% that was reported in the “advanced estimate.” When the revisions come out, it may not be the case that we had two consecutive periods of negative economic growth. This makes GDP reporting in real-time a tough metric to use to evaluate the economy, and why the NBER does not use GDP estimates when determining the start and end dates of a recession.
So, what do other metrics say about the economy?
Real Personal Income Excluding Transfer Payments
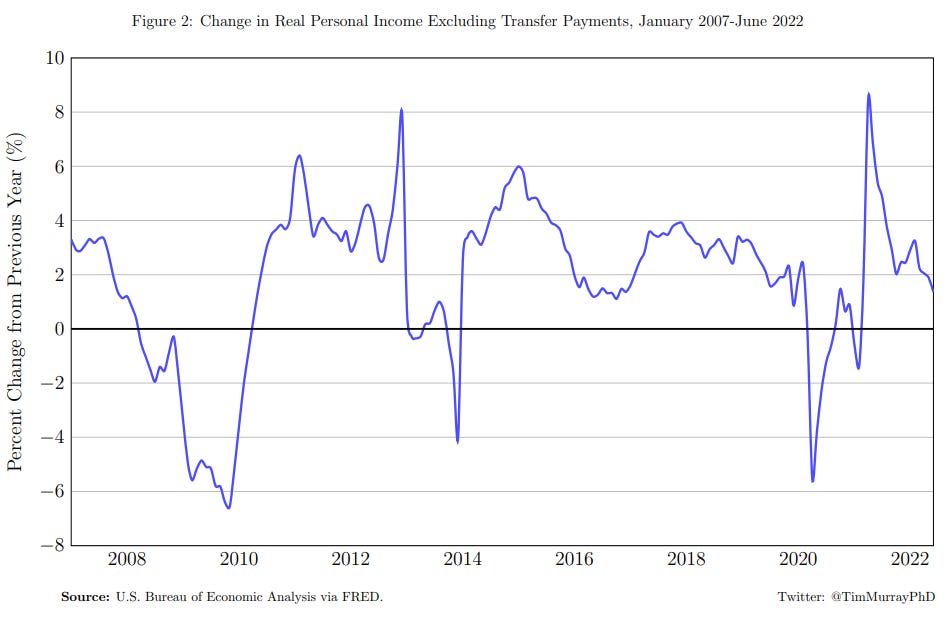
Figure 2 shows the percent change in personal income from one year ago, adjusted for inflation and before people receive any transfer payment from the government. In June 2022, real personal income was 1.36% higher than it was a year ago, but 0.28% lower than it was in May. Changes in personal income tend to jump from month to month, so for now, it is difficult to say that there are negative changes in personal income.
Total Employment

In June 2022, total employment is up 4.31% and the economy added 372,000 new jobs. The labor market remains very strong, the opposite of what we would expect to see in a recession.
Personal Consumption Expenditure and Retail Sales


In June 2022, real personal consumption spending is up 1.57% from a year ago and up 0.12% from May. Retail Sales are up 7.73% from a year ago and up 1.0% from May. Even with high inflation, people are still spending money on consumption. (To learn more about why inflation is high, see my previous post)
Industrial Production

Industrial production is an economic indicator that measures real output for all facilities located in the United States manufacturing, mining, and electric, and gas utilities. Industrial production is up 4.16% from a year ago, but down 0.20% from May. In the last few months, the growth rate of industrial production has declined.
Final Thoughts
The “advanced estimates” of GDP as reported by the BEA show that for the last 2 quarters, economic activity has declined in the United States. However, because real-time reporting of GDP is often revised and the quarterly GDP decline in the second quarter is less than 1%, it is not clear that GDP growth will remain negative after more data is available and the estimates are revised. The decline in the estimated GDP is due to a 3.56% decline in investment spending from quarter 1 in 2022 to quarter 2.
While consumer spending remains elevated, in spite of high inflation, the decline in investment spending by businesses could be a sign that companies do not anticipate this to continue, or it could be due to a decline in investment in real-estate constriction, both commercial and private. However, companies inventory levels are up 17.71% since last year and 1.43% since May. We would expect to see the opposite trend if companies were not anticipating being able to sell them.
Some of the economic data remains strong, particularly employment and consumer spending. If the economy were in a recession, we would see that companies would be laying people off due to a decline in consumer spending. We currently are not seeing that. However, we are seeing that industrial production may be slowing down and that personal income growth may be stalling as well, but we won’t know if these are concerning trends or just noise in the data for a few more months.
Is the US in a recession or about to enter a recession? It is possible. However, the data are not definitive yet, as some data show a strong economy, and others show that it might be slowing down. It could be that the economy had a really strong recovery from the pandemic due to low interest rates and stimulus spending, and now the recovery is over and things will return to a more normal state. It could be that high inflation is going to cause people to start spending less and companies laying off workers.
The reality is, it is too soon to tell one way or the other if the United States economy is in a recession, or not. So regardless of what you hear politicians or political talking-heads saying, we cannot say we are or are not in a recession. Some signs point in the direction we are headed that way, others point in the opposite direction suggesting that the economy is strong. Over the next few months, we can continue to evaluate the data and see what trends emerge. I will keep you updated on these trends.